KMSurvCure

This app simplifies survival analysis by calculating survival estimates, confidence intervals (CIs), and survival rates, while also allowing for the comparison of survival curves using the log-rank test. It generates Kaplan-Meier (KM) plots to visualize survival data over time.
Key Features:
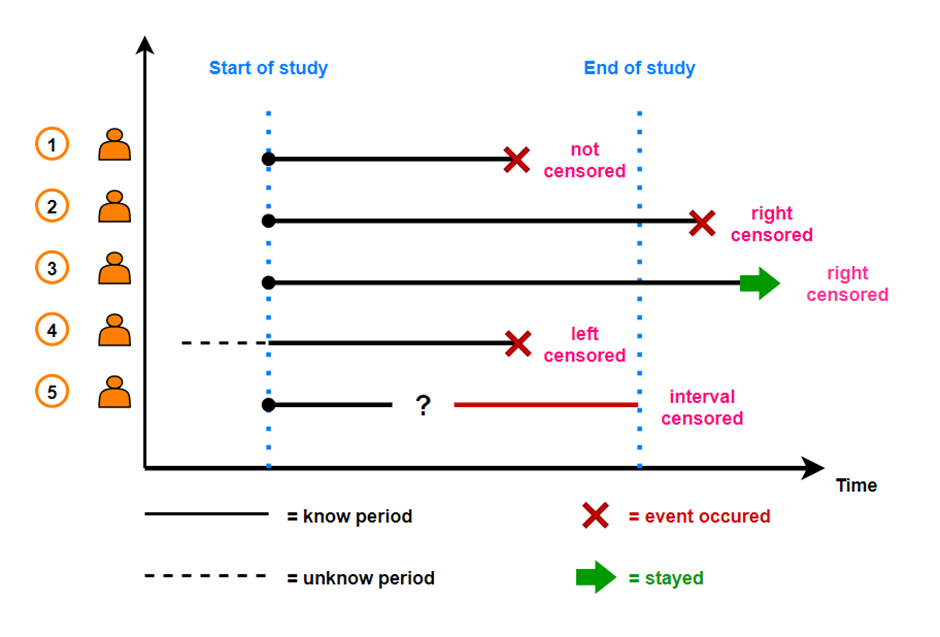
Kaplan-Meier Method: This method estimates the probability of survival over time, accounting for censored data. It provides a step-function curve that illustrates how survival probability changes as time progresses, offering a clear understanding of how different groups or treatments impact survival.
Survival Rates: The app calculates the proportion of subjects surviving at specific time points. These rates are essential in clinical research to measure the effectiveness of treatments or the progression of a disease.
Log-Rank Test: The log-rank test compares survival curves between two or more groups to assess whether there is a significant difference in their survival experiences. The log-rank p-value indicates if the difference in survival between groups is statistically significant. A low p-value (typically < 0.05) suggests that the survival curves are significantly different, while a high p-value suggests no significant difference.
By providing these tools, the app helps researchers and clinicians quickly and accurately interpret survival data, facilitating informed decisions and evidence-based conclusions in medical research.
